Edition 761 - January 25, 2019


by Master Trader Joe Ross
Author, Trader, Trading Mentor, and Founder of Trading Educators, Inc.
Developer of Instant Income Guaranteed
Chart Scan with Commentary: Brazilian Stocks
One of my most respected stock trading friends uses only weekly charts to trade stocks. This year his account is up considerably. Naturally, I wanted to know what he was doing. Riding above my mustache is a nose, and sometimes it is "nosy."
My friend informed me that he has been making a ton of money selling short Brazilian stocks that trade in the U.S. He said that a significant part of the gains made when he was long, were because of the rise of Brazilian stocks.
I asked him about his current position. He keys his trades from the Brazil Bovespa Index (IBV) for a clearer outlook for Brazilian stocks. He watches 20 Brazilian stocks in all, and he trades them using The Law of Charts, taking Traders Tricks ahead of 1-2-3s and Ross Hooks.
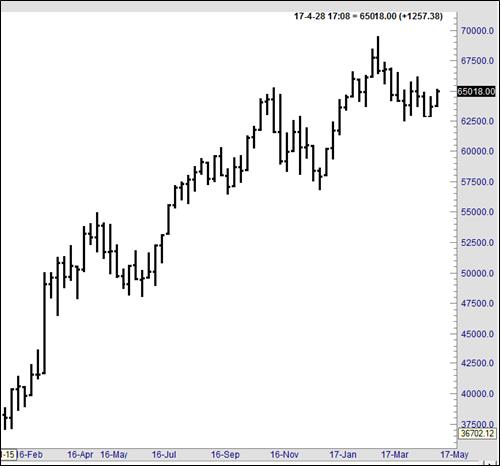
Below is a chart of the weekly Bovespa. As you can see, Brazilian stocks have been in an overall uptrend since January of 2016.
There is one caution with these stocks. Be aware that you must take into consideration the value of the Brazilian Real compared with the US dollar. You could be making money with the stocks, but losing money on the exchange rate.

© by Joe Ross. Re-transmission or reproduction of any part of this material is strictly prohibited without the prior written consent of Trading Educators, Inc.

by Master Trader Joe Ross
Author, Trader, Trading Mentor, and Founder of Trading Educators, Inc.
Developer of Instant Income Guaranteed
Trading Article: Chart vs. Technical Analysis
Is there a difference between chart analysis and technical analysis?
In my opinion there is. I am surprised at how many traders lump charting together with technical indicators into a category they call “Technical Analysis.” I am often accused of being a technical analyst because I am not a fundamental analyst. In the past, I’ve often carelessly, and without much thought, allowed myself to accept the general view that if you are not a fundamentals trader, you must be a technical trader.
If it hasn’t already been done by others, I want to create a category called “Chart Analyst.” I am a chart analyst (“Chartist,” if you prefer). I am not a market technician, I am not a fundamentals analyst, and I most certainly am not a technical analyst. I use technical indicators to about the same degree I use fundamental information for operating my trading business and making my trading decisions: very little.
My reading of charts does not preclude my use of fundamental information, nor does it preclude my use of a technical indicator when I deem such use to be appropriate to the operation of my trading business.
I refuse to be placed in a box of someone else’s making. If I have to be placed in a box, and apparently for many traders I do, then place me in the box of being a chart analyst. Why am I a chart analyst? Because it is the best way to see what’s going on that I’ve been able to discover.
I am not going to negate the value of fundamental information when such information can render a better result from my trading. I am not going to negate the use of a technical indicator when such an indicator can benefit my trading. But I am going to do the bulk of my trading from what I can plainly see on a bar chart showing me the open, high, low, and close.
Trading solely from fundamentals has too often gotten me in deep trouble. The same is true of trading exclusively from indicators. I want whatever gives me the best picture of reality.
© by Joe Ross. Re-transmission or reproduction of any part of this material is strictly prohibited without the prior written consent of Trading Educators, Inc.

by Philippe Guartier: Administration and
New Developments of Instant Income Guaranteed
Trading Idea: Instant Income Guaranteed
SQ Trade
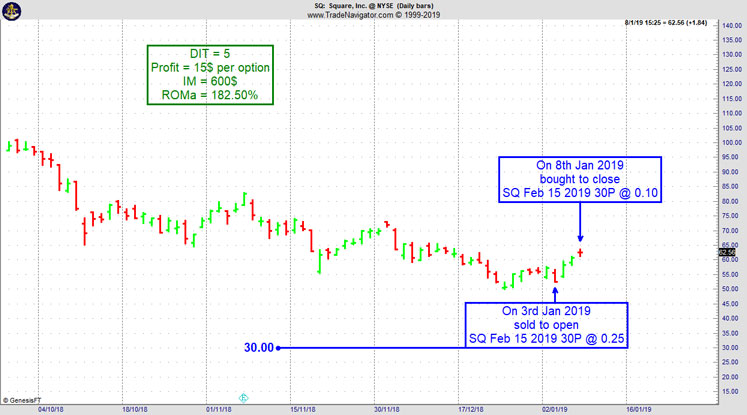
On 2nd January 2019 we gave our Instant Income Guaranteed subscribers the following trade on Square Inc. (SQ). Price insurance could be sold as follows:
- On 3rd January 2019, we sold to open SQ Feb 15 2019 30P @ 0.25, with 42 days until expiration and our short strike about 48% below price action, making the trade extremely safe.
- On 8th January 2019, we bought to close SQ Feb 15 2019 30P @ 0.10, after only 5 days in the trade
Profit: 15$ per option
Margin: 600$
Return on Margin annualized: 182.50%
Philippe
Receive daily trade recommendations - we do the research for you.
♦ SIGN UP TODAY! THIS IS WORTH THE INVESTMENT ♦

Learn More!
Instant Income Guaranteed
© by Joe Ross and Philippe Gautier. Re-transmission or reproduction of any part of this material is strictly prohibited without the prior written consent of Trading Educators, Inc.

by Professional Trader Andy Jordan
Educator for Spreads, Options, Swing, Day Trading, and
Editor of Traders Notebook Complete
Trading Article: Welcome the Idea of Breaking Even
No one enters a trade with the idea of breaking even as a goal. Rather, we set out with high hopes...read more.
Andy Jordan is the editor for Traders Notebook which shows you Futures Trading Strategies in Spreads, Options, and Swing Trades. Learn step-by-step how to trade successfully.
© by Andy Jordan. Re-transmission or reproduction of any part of this material is strictly prohibited without the prior written consent of Trading Educators, Inc.

by Professional Trader Marco Mayer
Educator for Forex, Futures and Systematic Trader
Creator of Ambush Trading Method, Ambush Signals, and Head of AlgoStrats.com
With Ambush Signals you can easily follow Ambush, a system specialized in catching intraday market tops and bottoms in the Futures markets.
Sign up for Ambush Signals Today!
LEARN ABOUT AMBUSH TRADING METHOD
With Ambush Signals you can easily follow Ambush, a system specialized in catching intraday market tops and bottoms in the Futures markets!
The most popular and easiest way to follow Ambush is Ambush Signals. It does all the work for you, allows you to customise what markets you want to see and has a position sizing tool implemented to automatically adjust the positions to your risk preferences.
Each day around 6:30 pm NY Time the Signals are available for you on the Dashboard. You can then place your orders and literally walk away until the next market close! To find out more about the details of Ambush and how Ambush Signals works, have a look at the Ambush Signals Website.
Let’s be realistic. Following any System can be tough, especially in the beginning. It simply needs time to build the confidence needed to make it through inevitable drawdowns. So what if you are unlucky and don’t catch a good start right away?
I want you to succeed trading Ambush Signals, so here’s something for you that will strongly increase your odds of success and allow you to easily gain the confidence you’ll need to become a long-term profitable Ambush trader.
Find out more about Ambush and Ambush Signals!
Did you come up with questions? Don't be shy, email Marco Mayer, he wants to hear from you! This email address is being protected from spambots. You need JavaScript enabled to view it.
© by Marco Mayer. Re-transmission or reproduction of any part of this material is strictly prohibited without the prior written consent of Trading Educators, Inc.
Check out our Blog!
To view previous published Chart Scan newsletters, please log in or click on "Join Us,"
shown above, to subscribe to our free "Members Only" section.
A WEALTH OF INFORMATION & EDUCATION:
Joe Ross-Trading Educators' popular free Chart Scan Newsletter has been published since 2004.
Note: Unless otherwise noted, all charts used in Chart Scan commentary were created
by using Genesis Financial Technologies' Trade Navigator (with permission).
Legal Notice and Copyright 2018 Disclaimer - Published by Trading Educators, Inc.
Chart Scan is a complimentary educational newsletter.


