Trading Educators Blog
Bollinger Bands in a Nutshell
Markets move between low volatility trading range moves and high volatility trend moves.
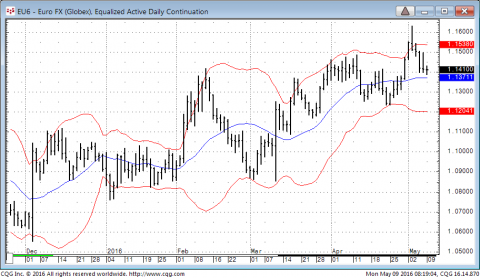
One of the best ways to see this taking place is with the Bollinger Bands.
When a market makes an extremely narrow range move the Bollinger Bands will noticeably narrow together.
When the bands narrow down it shows decreasing to low volatility condition on prices.
Of course, a low volatility market forecasts a high volatility trend move in the future. But when? Is it just around the corner, and how wide is that corner? No one can say for sure, but usually it is not far off.
To those who are patient to wait, this can be a nice trading setup. A money making opportunity is at hand. However you do need some sort of filter to indicate to you when the volatility expansion is beginning to take place. A 1-2-3 formation is often a good start.
The Bands narrowing together do not forecast the direction that the expansion will be but often times it is fairly clear from chart analysis which way the odds favor the breakout to be.