Trading Educators Blog
Double Bottom
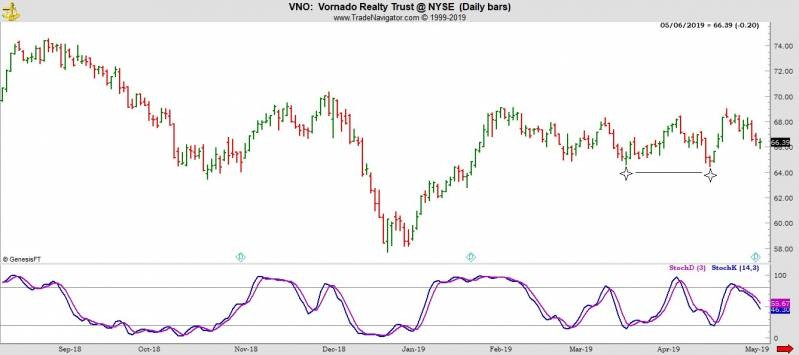
A Double Bottom pattern is a technical analysis charting pattern that describes a change in trend and a momentum reversal from prior leading price action. It describes the drop of a stock or index, a rebound, a drop to the same or similar level as the original drop, and finally another rebound. The double bottom looks like the letter "W". The twice-touched low is considered a support level. \/\/ Double bottoms trade well in conjunction with momentum indicators, such as Stochastics. Stochastics is a fixed parameter index. It has rigid confines at +100 and -100. Since Double Bottoms occur primarily in areas of consolidation, you can use a momentum indicator such as with a Stochastics reading of -25, at which point Stochastics are indicating "oversold."
We want to hear from you, Joe Ross wants you to learn trading. Email us your questions or if you need additional information. Another great investment is private mentoring with Joe, our students find this very helpful and accelerates their trading successes.